Wednesday 22 October 2014

Audacity Lab 3

Combining a number of audio tracks to a single audio master file

Mixing a Music session


  1. In Audacity open and listen to the file OriginalJingleMix.wav. How many different types of sound can you hear? Can you name the instruments or other sound sources?
    I heard: drums, bass, keyboard, guitar these play all play a riff throughout the music.
    I also heard vocals, a gong and a Hammond organ that you would hear in soul music.
  2. Session musicians recorded each of these tracks. Listen to each instrument track individually. Make notes on the quality of each sound. Quality of sound is very subjective. Use any adjective that you feel is appropriate to describe each sound. eg Does the Bass sound smooth or punchy? Is the guitar jangly or distorted? etc… How loud does each track sound in relation to one-another?
    TimpAndPiano- For the first half you hear timpani drums stuck twice loudly followed by a pause then they are struck 3 times you can hear the echo as if they are being recorded in a large hall. For the second half a low pitch piano riff plays there are 2 notes, then a pause followed by 4 notes, the last note is played 2 more times  quietly as the music fades out.
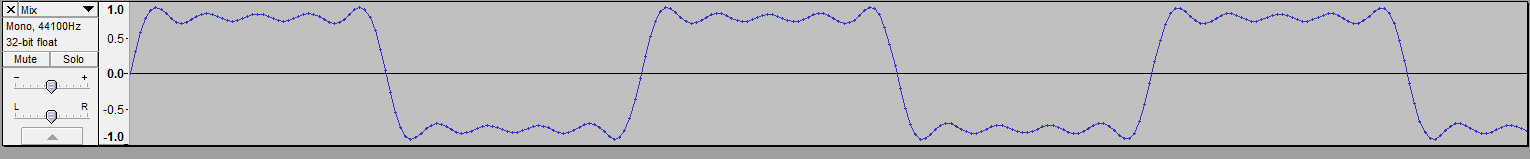
    SweepBass- The first half of the bassline is a 3 note repetition,  the last half of it is a repetition of one note plucked so heavily we hear the vibration of it as an echo, this whole bassline is heavily distorted making it sound punchy.
    Rickenbacker Bass Guitar- A series of 2 note repetitions followed by muted plucks followed by 3 note repetitions, their is a brief solo at the end followed by one notes echo then another note is played and we hear its echo. This bassline is much less distorted than the SweepBass making it sound more smooth.
    FunkGuitar- This funk guitar is playing very high chords with occasional muted chords and is distorted. The piece ends with the echo of the final chord. The guitar is very jangly making it sound like 80s surfer bands to me. The volume of the track is quieter than the basslines.
    Drums1- The drum beat makes use of a symbol, bass pedal and snare drum. The loudest and clearest of any instrument so far which is important since each instrument probably follows the drum beat. A gong is struck at the end which is surprising.
    DopeOrgan- The most notable feature of the song is this organ, it doesn't start until 2 seconds in. A chord is played and held in for half a second followed by some short spiky single notes then another chord, this is repeated 3 times.
    DloopandAnnouncer- The track starts with silence for 2 and a half seconds then a drum is struck loudly followed quickly by 2 lighter strikes this is repeated 3 more times, there is another pause for 7 seconds. Then the line "sounds beyond cool" is said by an announcer  in an exaggerated distorted voice.
    CEPVoices- The vocals don't start until 5 and a half seconds in, it is a cantata "accompanied singing" of 4 men, however, the first line is said by one man, the second by two men, the third by three men and the fourth by all four. I detect a hint of voice effects perhaps autotune. The voices all harmonize well and the track quickly fades out.
  3. Look at each track in the time domain and frequency domain and make note of any distinct features. eg. What time does each sound event occur, loudness in dB, duration, envelope shape… What frequencies does it tend to occupy. How do these features inform your own personal impression of the sound as you hear it?
    TimpAndPiano- Starts at 0 seconds and fades out around 5 seconds in. Hits a trough of -36dB and has a low pitch. Frequency caps at about 7kHz.
    SweepBass- Stars at 0 seconds Hits a height of -24dB. the wave form has lots of breaks and gets lower pitched over the first half. The max frequency is roughly 5kHz.
    Rickenbacker Bass Guitar- Starts at 0 seconds. Hits a height of -24dB. Their are a bunch of muted notes where there would be breaks usually.  The highest frequency is 7.7kHz
    FunkGuitar- Starts around half a second into the track and fades out between 11 and 14 seconds. The peak is -39dB and 7.7kHz
    Drums1- Starts at 0 seconds and the gong is struck around 11 seconds in and fades out until 16 seconds. The loudest amplitude of all the tracks at -27dB and has the highest frequency of 22kHz.
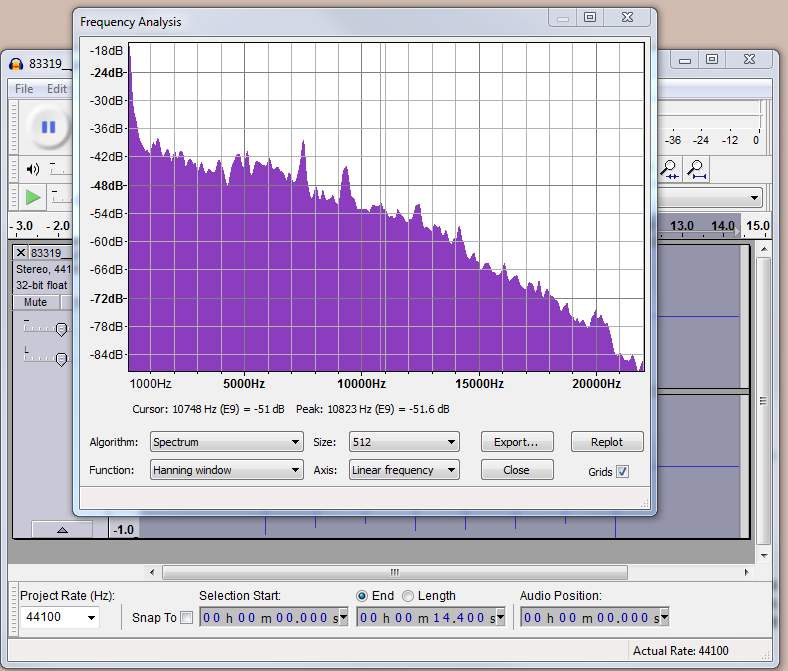
    DopeOrgan- Starts at 2 seconds in and ends at 11 seconds in. Each held in long note is followed by short spikes of notes. The track peaks at 36dB and about 10.8kHz
    DloopandAnnouncer- The first part of the track starts at 2.5 seconds and ends at 5.5. The second part of the track starts at 12.5 seconds and fades out at 16 seconds. The drum waveform is a clear repetition 4 times, the voice waveform is unpredictable and varies in amplitude. They peak at 27dB and 21.8kHz.
    CEPVoices- Starts at 5.5 seconds and fades out until 13.5 seconds. there is minimal breaks and the voices are fairly high pitch. Peaks at 24dB and 22kHz.
  4. Use the mix feature of Audacity for each track to create the final mix for this jingle. Be sure to use control-A to select all of each wav before mixing to the waveform mix waveform. Check that the waveform sounds as expected. (It should be identical to the OriginalJingleMix track)

    The waveform I created sounds exactly the same as the Original JungleMix track .

Creating your own version of the mix


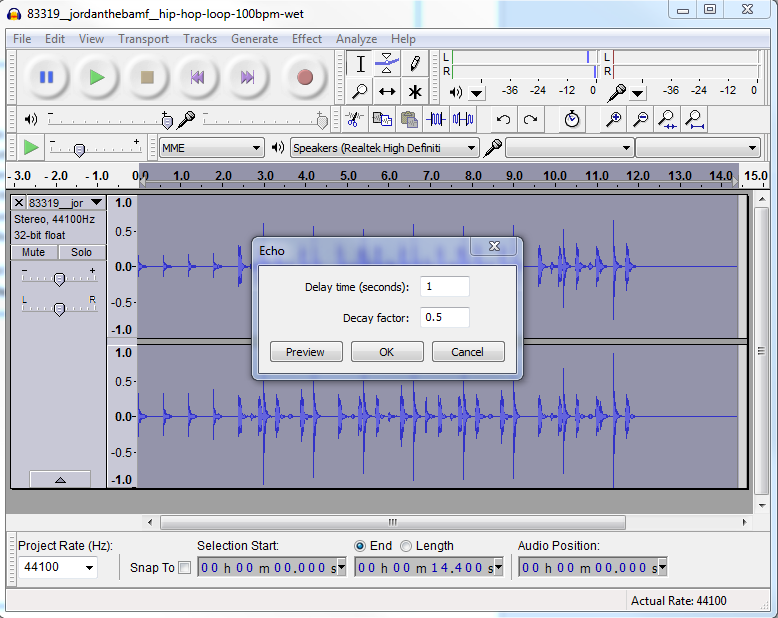
Using the previously explored features of Audacity, modify the component wav files before mix to produce a new style of mix…
  1. Make the Bass Guitar less prominent, Make the guitar sound smoother and Make the whole mix sound as if it was recorded in a large room.
    I used the equalizer effect to equalize the amplitude of the piece making the bass guitars less prominent. 

    I changed the frequency of the guitar to make it slightly less high pitched and it's amplitude to make it louder.
    For the large room recording effect I used reverb and set the room size to 100%.
  2. Make a special mix to your own taste, you may edit each individual track before mixing as many time as you feel necessary experimentation is the key here. You can even record you own tracks if you wish or add wavs obtained from freesound.org in the mix.

Matching an audio track to video events


In the early days this was called “Mickey mousing” where an organist in the cinema would improvise sounds to match the events taking place in cartoons and movies. This aimed to create a sense of drama, suspense, excitement and surprise in the mind of the viewer. We can do the same with video computer games or animation. Open the OldMovie file using Microsoft Movie Maker. Watch the film many times and make a note of any events that you consider important. When do they start when do they stop? Are they sudden or gradual?
The music starts as the title card of the video shows and keeps playing as we see the person swing as if we are to think he was already swinging on the flying fox before we saw him.
The guitar stops suddenly at the same time the person puts his feet down to stop himself.
The guitarist resumes finger plucking as the person unharnesses himself and a chord is abruptly played as soon as he finishes.
The guitar resumes as soon as we see another person start swinging along.
One note is held in as their is a time skip kind of like an ellipsis.

Around 35 seconds in the music starts to play slowly and calmly as if the video will end soon.
At 45 seconds the final chord plays as the conclusion to the video and the ending title shows up.

Open-ended task


Use Wavosaur and any wavs from today’s exercise or freesound.org to create an appropriate Mickey mouse tack for the video being careful to match audio event times to video event times. Once again time, effort and experimentation are key here.

When you are happy with audio track mix it into the video and ask a fellow student to assess your final product. (Use Microsoft Movie Maker to replace the audio track with the one that you have created.)

Keep all of your audio and video work from today’s session as you will be required to submit it on week 12.
I added an audience cheer whenever someone is about to complete their swing, each cheer is amplified so it gets louder every time it's played. There is a total of 4 cheers one for each swing.
I did this to make the video gradually more exciting, the music is very laid back and relaxing and it contrasts with the excitement of the swinging, I added  the cheers to aid in portraying the excitement the people swinging had at the time.
Here is a link to my Mickey mouse track for the video:
https://www.youtube.com/watch?v=PO3Ivj6ooY8

Audacity Lab 2

AIVP Laboratory 2 2014


Audio Signal Processing – Generating Signals with Audacity.
Make lab notes, sketches, graphs complete tables and answer questions.


Tones, Harmonics, Spectra and Spectrograms


  1. -PCM stands for pulse-code modulation, a digital representation of an analog signal (in this case, sound waves). The more bits you use, the more accurate the digital representation. But in addition to bits, there's another thing that influences the quality. It's the frequency, which is measured in kilohertz (kHz). Audio CD quality is 16 bit and 44.1 kHz, so if you're ripping to WAV files that's the highest quality you need to use. Any higher and you'll just be using more space without improving quality.
  2. Use Audacity Help at any time.
  3. Use the Generate->Tone option to generate 1 second of a sinusoid (single pure tone) of frequency 440 Hz at amplitude 1, mono, 16bit, sample rate (frequency) 44100 kHz. Save the pure tone as a *.wav file in C:\TEMP or on your pen drive if you have one.
    This is my tone generation.

  4. (I used units aproximately close to 1/3, 1/7 and 1/9 in audacity)
Harmonic
Number
1
2
3
4
5
6
7
8
9
Amplitude relative to Fundamental
Let it be x
1

1
0
1/3

0.333
0
1/5

0.2
0
1/7

0.143
0
1/9

0.111
Amplitude in dB
20 log x
0

-9.55

-13.98

-16.89

-19.09
Here is the fundamental followed by all the harmonics before they were added together
When added together they made this wave form

  1. When the fundamental and all of the harmonics are combined the waveform is approaching a square shape, the amplitude becomes an average of the combined amplitudes it stays almost as loud as the fundamental meaning the harmonics only affect it slightly. When the wave peaks and rises transitioning between every box shaped wave those are periods when most of the harmonic waves were transitioning (think of each harmonic like a vote and on average most of them want to go down at certain points and up at others). The frequency of the whole box if you look at the wave that way isn't changed much from the fundamental but the waves within that shape are affected strongly by the fundamentals.
  2. Similarly to the previous lab view the frequency content (Magnitude Spectrum) of the waveform using the Analyse->Plot Spectrum option. Compare the peaks in this display with the fundamental and the harmonics you have added to it. Sketch or cut and paste the spectrum in your lab note and describe it.
fundamental
3rd harmonic added
5th harmonic added
7th harmonic added
9th harmonic added
With the addition of each harmonic the amplitude peak for each harmonic is lower than the previous, the fundmental hits 0dB and the 3rd harmonic hits -11.5dB, the frequency goes up by roughly a third each time a fundmental is added, I came to this conclusion due to the fundamental frequency appearing as 2000Hz and after the 3rd, 5th and 7th harmonic are combined it appears as 4000Hz 

  1. Now view the Spectrogram of the waveform using the audio track triangle and selecting spectrum setting. Describe and sketch this result in your note. Save the final waveform as a *.wav file in C:\TEMP. Listen to the waveform and compare it with the sound of the original pure tone sinusoid.
Spectogram shows intensity by colour or brightness on the axis of frequency and time.
With all the harmonics added it sounds higher pitched than the pure tone due to the added frequency each time a harmonic is added. The original tones amplitude peaks higher than the harmonic tone although each wave doesn't stay there for long, the harmonic tone's amplitude is louder overall due to the box shape wave less of a break descending from the high amplitude.
As a listener the harmonic tone sounded more unpleasant than the original due to the consistent loud tone that there is less of a break from.
  1. Now start afresh and add to the Fundamental pure tone the harmonics up to and including the 5th in the proportions shown below. Display and sketch the waveform each time you add another harmonic.
Harmonic
Number
1
2
3
4
5
Amplitude relative to Fundamental x
1

1
1/2

0.5
1/3

0.333
1/4

0.25
1/5

0.20
20 log x
0
-6.02
-9.55
-12.04
-13.98
fundamental
fundamental spectrum
2nd harmonic added
3rd harmonic
4th harmonic
5th harmonic


  1. What shape is the waveform gradually approaching?
    The wave gradually becomes more and more of a sawtooth shaped wave.
  2. View the frequency content (Magnitude Spectrum) of the waveform as previously. Identify the peaks in this display with the fundamental and the harmonics you have added to it. Sketch it in your lab note.
    Pictured above. 
  3. Like the first time each time a harmonic is added it's amplitude peak is lower than the wave before it, however the frequency is increasing at half the rate compared to the first time, I think this is because the first time we moved up 2 successive waves (1-3-5...) and this time we were moving up 1 (1-2-3...) and each successive wave has a higher frequency so if we increment 2 harmonics at a time the  frequency will end up roughly double as high.
The tone sounds flatter than the fundamental tone, it also sounds like it's buzzing, the pitch is medium in between the original tone and the 9th harmonic tone I created earlier.


Noise, Mixing, Signal-to-noise ratio, and Filtering


  1. Open the waveform noise1.wav This is a white noise file. Listen to this nuisance file. View and sketch this waveform in the time domain and in the frequency domain.


  2. Add a sinusoid of amplitude 0.02, 1kHz frequency of 1s duration. Does the resulting waveform look sinusoidal? How does it sound? How does it look in the frequency domain?
    The resulting waveform is shaped like sine wave so it is sinusoidal. The tone is a high pitched beep not as loud as the others though. The trough is at 10.2 dB and the frequency peaks at 1000 Hz.


  3. View and sketch the spectrum, view the spectrogram, and listen to the waveform. Locate the pure tone if possible. Save the mixed waveform as an *.wav file in C:\TEMP.


  4. Try using the Effect Graphic Equaliser options of Audacity to select the tone and reject the noisy in the waveform( we need a slider at max at 1000KHz and sliders at zero elsewhere if possible). Does the waveform look more sinusoidal than before? If so is the period of the waveform approaching that of the original pure tone? How does it sound? To what extent did this filtering work?
    The waveform does look more sinusoidal than before. The period of the waveform is approaching that of the original pure tone. There isn't as much white noise as before although there is still some. The filtering has worked somewhat.
  5. On waveforms of your choice from freesound.org explore the effect of the other filter options that are available.
    I used a stereo wave form of a 5 second piano riff.

    To begin with i reversed the track making it sound very surreal like playing a record in reverse you hear the echo of each note before each note is played. I added fade to the end of the wave worm, there was originally a large amplitude spike at the start which became a large spike at the end when I reversed it, I added fade to smoothly transition out of the track, this got rid of the problem of the large amplitude spike and brings the track to a calm finish.

Wednesday 8 October 2014

Week 3 - Human hearing

Sound: Sounds are vibrations
EarDivided into your outer, middle and inner ear
CochleaPart of your inner ear, where your actual organ of hearing is located
The outer ear consists of the pinna, ear canal and eardrumThe middle ear consists of the ossicles and ear drumThe inner ear consists of the cochlea, the auditory (hearing) nerve and the brain
Locating sounds: Sound reaches your two ears at different times, enabling you to locate its source

Ears, nerves and brain: Your ears are your organs of hearing. In order to hear, however, you also need your cochlear nerves to transmit nerve impulses to your brain, which then interpret the sounds coming from the world surrounding you.

Week 3 - Focus of Activity

1. λ=v/f.  333/1000 = 0.333 metres.
Remembering the Vfλ triangle/calculations are important here.
I learned acoustic waves travel with the speed (velocity) of sound, 333m/s.
2.  λ=v/f. 5000/440 = 11.4 metres.
I learned concert pitch is 440Hz.
Through a steel which is a solid, sound travels through steel at 5,000m/s
I am assuming the question I am being asked is the wavelength of the sound when it is travelling through the tuning fork.
3. f=v/λ. 333/3.33 = 100Hz.
Sound travels quickest through a solid with the particles being so close together.
4. The duration of a cycle is a second divided by the frequency.
So the duration of the cycle with a frequency of 20Hz is:
1/20s = 0.05 seconds.

5. A standing wave can occur because the medium is moving in the opposite direction to the wave, or it can arise in a stationary medium as a result of interference between two waves traveling in opposite directions.
A real life example of this is gliders using standing waves that form in the lee of mountain ranges to their advantage.

6. Where two waves meet, their effects are added together. This is called interference.
When they arrive in step, they reinforce each other to give a wave of greater amplitude. This is called constructive interference.
When they arrive out of step, they cancel out. This is called destructive interference.
7. The amplitude of an acoustic wave determines its loudness.
8. Decibel is used to indicate the level of acoustic waves and electronic signals. The logarithmic scale can describe very big or very small numbers with shorter notation.
9. A 1KHz tone has a period of 1/1000 or 0.001s. So it will take 20/0.001 = 20,000 seconds
A 10Hz tone has a period of 1/10 or 0.1s. So it will take  20/0.1 = 200 seconds.
10. The speed of sound in water is slower than in a solid because the particles are more spaced out, however, it is faster than in air because the particles are closer together.

Wednesday 1 October 2014

Week 2 - Digital signal processing

Digital Signal Processors (DSPs) take real-world signals like voice, audio, video, temperature, pressure, or position that have been digitized and then mathematically manipulate them.


  • Converters such as an analogue-to-digital converter then take the real-world signal and encodes it in binary (1's and 0's).
  • DSP takes over here and captures the digitized information and processing it. It then feeds the digitized information back for use in the real world.
  • It does this in one of two ways, either digitally or in an analogue format by going through a Digital-to-analogue converter.

  • A low-pass filter is an electronic filter that passes low-frequency signals but attenuates (reduces the amplitude of) signals with frequencies higher than the cutoff frequency. 
  • In smoothing, the data points of a signal are modified so that individual points that are higher than the immediately adjacent points (presumably because of noise) are reduced, and points that are lower than the adjacent points are increased. This naturally leads to a smoother signal. As long as the true underlying signal is actually smooth, then the true signal will not be much distorted by smoothing, but the noise will be reduced.
Pitch
The sensation of a frequency is commonly referred to as the pitch of a sound. 
A high pitch sound corresponds to a high frequency sound wave and a low pitch sound corresponds to a low frequency sound wave
DSP 1. Precision
In theory the precision of Digital Signal Processing systems is limited only be the conversion process at input and output (analogue to Digital and Digital to analogue).
In practice, sampling rate (sampling frequency) and word length restrictions (number of bits) modify this. 
DSP 2. Robustness
Due to logic level noise margins, digital systems are inherently less susceptible to:
  1. Electrical noise (pick-up)
  2. Components tolerance variations
DSP 3. Flexibility
Programmability allows upgrading and expansion of the processing operations, without necessarily incurring large scale hardware changes.
Practical systems with desired Time Varying and / or Adaptive characteristics can be constructed.
How a Sound card works
  • Sounds and computer data are fundamentally different. 
  • Sounds are analogue - they are made of waves that travel through matter. 
  • People hear sounds when these waves physically vibrate their eardrums. 
  • Computers, however, communicate digitally, using electrical impulses that represent 0s and 1s. 
  • A sound card translates between a computer's digital information and the outside world's analogue
Sampling rate
Sample rate indicates the number of digital samples taken of an audio signal each second. 
This rate determines the frequency range of an audio file. 
The higher the sample rate, the closer the shape of the digital waveform is to that of the original analog waveform.
To reproduce a given frequency, the sample rate must be at least twice that frequency.
CDs have a sampling rate of 44.1KHz so they can reproduce frequencies up to 22.05KHz, which is just beyond the limit of human hearing, 20KHz.
Bit depth
When a waveform is sampled each sample is assigned the amplitude value closest to the original analogue wave
CD quality sound is 16bit which means that each sample has 65,536 possible amplitude values.
DVD quality sound is 24bit which means that each sample has 16,777,216 possible values.
Dynamic range
The ratio of the Largest Signal Amplitude to the Smallest, is known as the Dynamic Range.
Since a 16 bit Word length allows 216 (i.e. 65536) different signal levels the dynamic range (DR) is calculated as
DR = 20log([ Voltage Range] / [ quantisation Step Size]) dB
=20log(216) dB
= 96 dB

AIVP Laboratory Session 1

Task 1

The trough of this wave starts at 07.699s and the crest peaks at 07.704s within this very short period of 0.005s or a two hundredth of a second the amplitude rises gradually from -0.25dB to 0.25dB at a shallow pace.
The size of the crest is roughly the opposite of the size of the trough beforehand this is an example of particles following the motion of earlier particles in the medium.
Task 2
My original wave was a walking pace hip hop drum beat using a snare and bass drum with a tambourine struck occasionally.
Perfect for adding layers of instruments onto.

I experimented by adding in an echo with a delay factor of 0.5 this transformed the slow hip hop beat and made it sound like rapid timpani drums because the echoing snare made it seem twice as fast. The tambourine seemed like it was being shaken twice rather than struck once because you were hearing the echo.
Overall I think that the echo overpowers the free space left to add layers of instruments onto making it ill advised to do so.
Task 3

  • Plot Spectrum takes the selected audio (which is a set of sound pressure values at points in time) and converts it to a graph of frequencies (the horizontal scale in Hz) against amplitudes (the vertical scale in dB).
  • The frequencies can be displayed on a linear scale (default, which gives equal width to each increment on the scale) or on a logarithmic scale. The log scale gives greater display width to low frequencies. Linear view can be useful to show harmonics (a component frequency of the sound that is a whole number multiple of the fundamental frequency).
  • A decibel is a unit used to measure the intensity of a sound or the power level of an electrical signal by comparing it with a given level on a logarithmic scale.
  • In general use a decibel is a degree of loudness.
Task 4
With reverb turned on the echo of each each drum beat slowly fades out it sounds like drums are being played in a gym hall rather than a recording studio, this process is known as damping because the sound is simulated as being absorbed by walls, floor, ceiling and air.
I used a much small room reverb preset to compare to my large "gym hall" like previous one. Each drum beat after being struck fades out for a split second before bouncing back louder again, then fades then bounces back repeatedly until it fades out. this is to simulate the claustrophobic space the sound is trapped in and cannot escape so it keeps bouncing off of the walls and ceilings like a squash ball finding it difficult to fade out gradually.
Task 5
In audacity I experimented and found out you can:
  • Record live audio through a microphone or mixer.
  • Change the pitch without altering the tempo (or vice-versa).
  • Adjust volume with Compressor, Amplify, Normalize, Fade In/Fade Out and Adjustable Fade effects.
  • Use spectrogram view modes for visualizing frequencies.