AIVP
Laboratory 2 2014
Audio
Signal Processing – Generating Signals with Audacity.
Make lab notes, sketches, graphs
complete tables and answer questions.
Tones, Harmonics, Spectra and Spectrograms
- -PCM stands for pulse-code modulation, a digital representation of an analog signal (in this case, sound waves). The more bits you use, the more accurate the digital representation. But in addition to bits, there's another thing that influences the quality. It's the frequency, which is measured in kilohertz (kHz). Audio CD quality is 16 bit and 44.1 kHz, so if you're ripping to WAV files that's the highest quality you need to use. Any higher and you'll just be using more space without improving quality.
- Use Audacity Help at any time.
- Use the Generate->Tone option to generate 1 second of a sinusoid (single pure tone) of frequency 440 Hz at amplitude 1, mono, 16bit, sample rate (frequency) 44100 kHz. Save the pure tone as a *.wav file in C:\TEMP or on your pen drive if you have one.
 This is my tone generation.
- (I used units aproximately close to 1/3, 1/7 and 1/9 in audacity)
Harmonic
Number
|
1
|
2
|
3
|
4
|
5
|
6
|
7
|
8
|
9
|
Amplitude
relative to Fundamental
Let
it be x
|
1
1 |
0
|
1/3
0.333 |
0
|
1/5
0.2 |
0
|
1/7
0.143 |
0
|
1/9
0.111 |
Amplitude
in dB
20
log x
|
0
|
-9.55
|
-13.98
|
-16.89
|
-19.09
|
Here is the fundamental followed by all the harmonics before they were added together

When added together they made this wave form
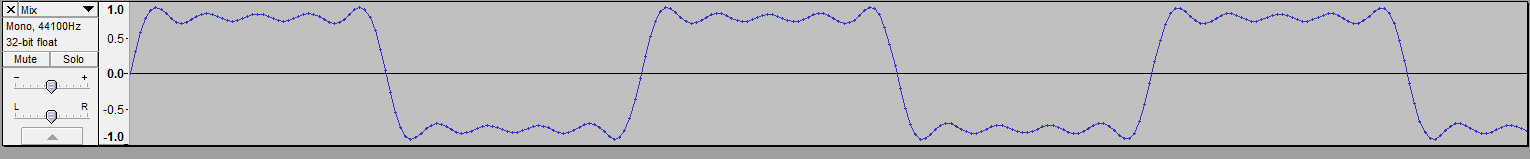
- When the fundamental and all of the harmonics are combined the waveform is approaching a square shape, the amplitude becomes an average of the combined amplitudes it stays almost as loud as the fundamental meaning the harmonics only affect it slightly. When the wave peaks and rises transitioning between every box shaped wave those are periods when most of the harmonic waves were transitioning (think of each harmonic like a vote and on average most of them want to go down at certain points and up at others). The frequency of the whole box if you look at the wave that way isn't changed much from the fundamental but the waves within that shape are affected strongly by the fundamentals.
- Similarly to the previous lab view the frequency content (Magnitude Spectrum) of the waveform using the Analyse->Plot Spectrum option. Compare the peaks in this display with the fundamental and the harmonics you have added to it. Sketch or cut and paste the spectrum in your lab note and describe it.
fundamental

3rd harmonic added

5th harmonic added

7th harmonic added

9th harmonic added

With the addition of each harmonic the amplitude peak for each harmonic is lower than the previous, the fundmental hits 0dB and the 3rd harmonic hits -11.5dB, the frequency goes up by roughly a third each time a fundmental is added, I came to this conclusion due to the fundamental frequency appearing as 2000Hz and after the 3rd, 5th and 7th harmonic are combined it appears as 4000Hz
- Now view the Spectrogram of the waveform using the audio track triangle and selecting spectrum setting. Describe and sketch this result in your note. Save the final waveform as a *.wav file in C:\TEMP. Listen to the waveform and compare it with the sound of the original pure tone sinusoid.
Spectogram shows intensity by colour or brightness on the axis of frequency and time.
With all the harmonics added it sounds higher pitched than the pure tone due to the added frequency each time a harmonic is added. The original tones amplitude peaks higher than the harmonic tone although each wave doesn't stay there for long, the harmonic tone's amplitude is louder overall due to the box shape wave less of a break descending from the high amplitude.As a listener the harmonic tone sounded more unpleasant than the original due to the consistent loud tone that there is less of a break from.
- Now start afresh and add to the Fundamental pure tone the harmonics up to and including the 5th in the proportions shown below. Display and sketch the waveform each time you add another harmonic.
Harmonic
Number
|
1
|
2
|
3
|
4
|
5
|
Amplitude
relative to Fundamental x
|
1
1 |
1/2
0.5 |
1/3
0.333 |
1/4
0.25 |
1/5
0.20 |
20
log x
|
0
|
-6.02
|
-9.55
|
-12.04
|
-13.98
|
fundamental

fundamental spectrum

2nd harmonic added

3rd harmonic

4th harmonic


5th harmonic


- What shape is the waveform gradually approaching?
The wave gradually becomes more and more of a sawtooth shaped wave. - View the frequency content (Magnitude Spectrum) of the waveform as previously. Identify the peaks in this display with the fundamental and the harmonics you have added to it. Sketch it in your lab note.
Pictured above. - Like the first time each time a harmonic is added it's amplitude peak is lower than the wave before it, however the frequency is increasing at half the rate compared to the first time, I think this is because the first time we moved up 2 successive waves (1-3-5...) and this time we were moving up 1 (1-2-3...) and each successive wave has a higher frequency so if we increment 2 harmonics at a time the frequency will end up roughly double as high.
The tone sounds flatter than the fundamental tone, it also sounds like it's buzzing, the pitch is medium in between the original tone and the 9th harmonic tone I created earlier.
Noise, Mixing,
Signal-to-noise ratio, and Filtering
- Open the waveform noise1.wav This is a white noise file. Listen to this nuisance file. View and sketch this waveform in the time domain and in the frequency domain.


- Add a sinusoid of amplitude 0.02, 1kHz frequency of 1s duration. Does the resulting waveform look sinusoidal? How does it sound? How does it look in the frequency domain?

 The resulting waveform is shaped like sine wave so it is sinusoidal. The tone is a high pitched beep not as loud as the others though. The trough is at 10.2 dB and the frequency peaks at 1000 Hz.
- View and sketch the
spectrum, view the spectrogram, and listen to the waveform. Locate
the pure tone if possible. Save the mixed waveform as an *.wav file
in C:\TEMP.


- Try using the Effect Graphic Equaliser options of Audacity to select the tone and reject the noisy in the waveform( we need a slider at max at 1000KHz and sliders at zero elsewhere if possible). Does the waveform look more sinusoidal than before? If so is the period of the waveform approaching that of the original pure tone? How does it sound? To what extent did this filtering work?
 The waveform does look more sinusoidal than before. The period of the waveform is approaching that of the original pure tone. There isn't as much white noise as before although there is still some. The filtering has worked somewhat.
 - On waveforms of your choice from freesound.org explore the effect of the other filter options that are available.
 I used a stereo wave form of a 5 second piano riff.
 To begin with i reversed the track making it sound very surreal like playing a record in reverse you hear the echo of each note before each note is played. I added fade to the end of the wave worm, there was originally a large amplitude spike at the start which became a large spike at the end when I reversed it, I added fade to smoothly transition out of the track, this got rid of the problem of the large amplitude spike and brings the track to a calm finish.
No comments:
Post a Comment